
International data suggests a genuine problem
All HART articles also on Substack. Please consider a PAID SUBSCRIPTION so we can continue our work. Comments are open so you can join in the conversation.
Many of our readers will be aware of the claims of a rise in cancers since the vaccine rollout, particularly among the young. Last week we published an article discussing the scientific rationale why a rise in cancers might be expected after the vaccine rollout. The data published by the UK on this topic is contradictory but data from around the world is signifying there is a genuine problem.
The first to raise the alarm were those with experience of noticing trends in data in the financial world. Within medicine great emphasis is placed on statistically significant (ie at the 95% level) deviations, a high bar which means that early signals, noticed as a change in direction, get ignored.
Since November 2020, the account @EthicalSkeptic has shared data from the USA showing a rise in cancer. The methodology used has included modelling to account for cancer deaths that occurred earlier than otherwise because of covid and covid policy. He/She also includes adjustments for cancer deaths being mislabelled as covid deaths. Rather than engage with the merits or otherwise of this methodology his critics had dismissed his claims using a series of methodological trickery which he lists here.
The first person to put his name and face to the claims of a problem was Ed Dowd who spent a career in Wall Street ending up as a portfolio manager for BlackRock. He worked with analysts from the insurance industry to show a 61,000 excess deaths of 25-44 year olds in the US which he described in October 2022, as “a Vietnam war in the second half of 2021.” That number alone was being explained away as being due to covid, and worse, as evidence the vaccines were working well among older age groups. By mid-July 2023 he started reporting on surges in disability claims in the UK – Personal Independence Payments or PIP. These revealed a staggering increase in certain claim groups from early 2021 with the vaccine rollout. Ed Dowd has also highlighted a shocking increase in cancer mortality among younger age groups.
Here is where the conflicts arise. First of all, comparing the whole population, the pattern for cancer deaths does show a rise but of only 1% which is within what might be expected for year to year variation. The flaw with this approach is that older age groups have had fewer deaths after a period of high mortality in 2020 and 2021. They can only die once. The trajectory for the old is most clearly seen by looking at dementia and Alzheimer’s deaths where the numbers of deaths have been below baseline since 2021. A lack of cancer deaths in the old would drown out a rise in younger age groups when looking at the whole populaiton. The Office of Health Disparities has published separately by age but the data only goes up to July 2022 despite the last publication being released on October 2023. Cancer deaths were at expected levels – but the data has not been updated.
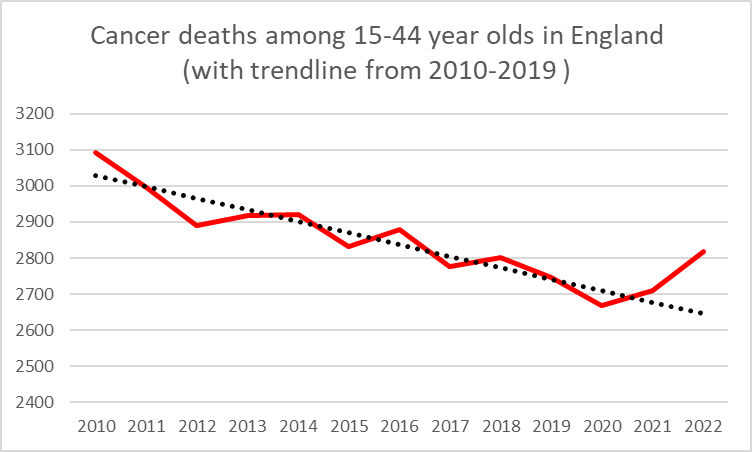
There is a rise seen in ONS data.
A worse rise is seen when looking at deaths by date of occurrence for England and Wales compared to previous years.
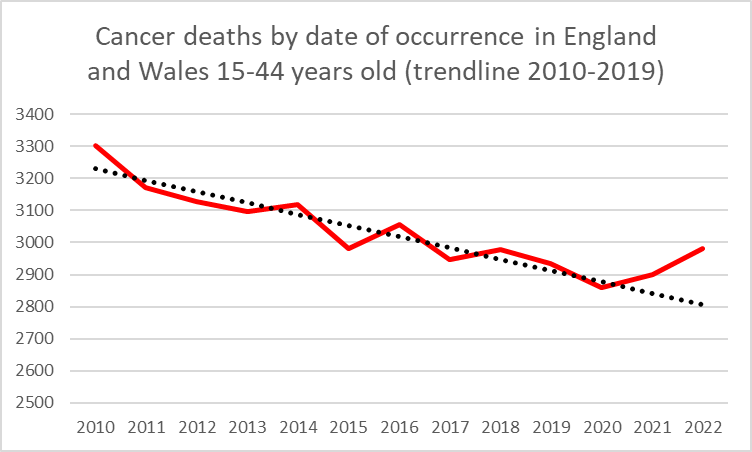
No adjustment for any data lag has been made in the above graph – it is just raw data. Despite this clear signal in the ONS data, (which can also be found on NOMIS) concerns have been dismissed by Andrew Stephenson, Minister of State for Health and Secondary Care as being due to adjustments to account for a data lag.
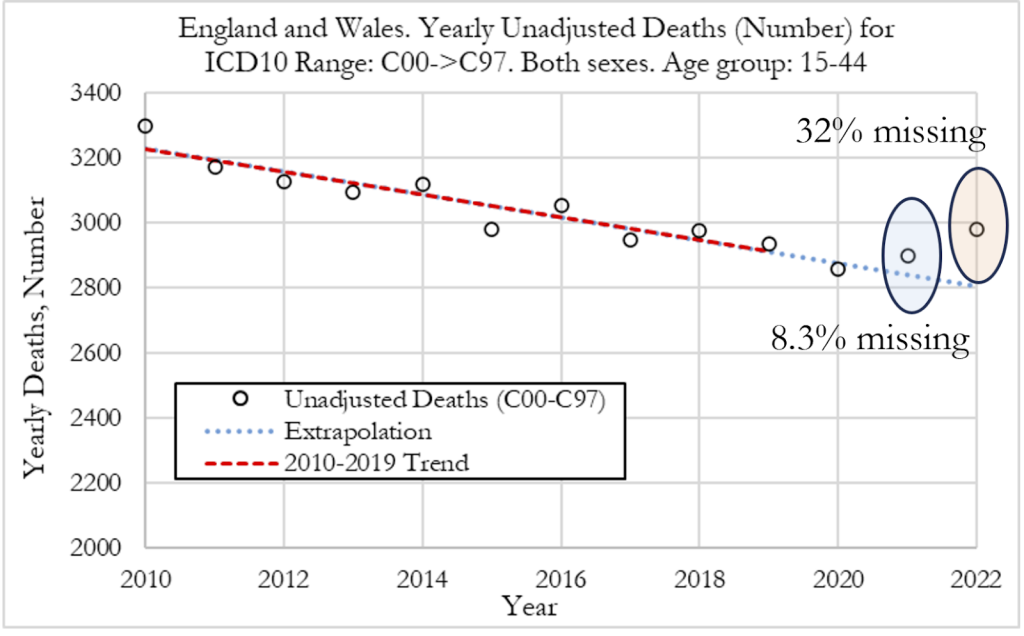
Member’s of Ed Dowd’s team have published a graph with this same data commenting on the potential data lag – but without making adjustments to account for it. It is more than reasonable to point to the problems with death data by date of registration and to try and account for data lags – but the signal is clear even before doing that.
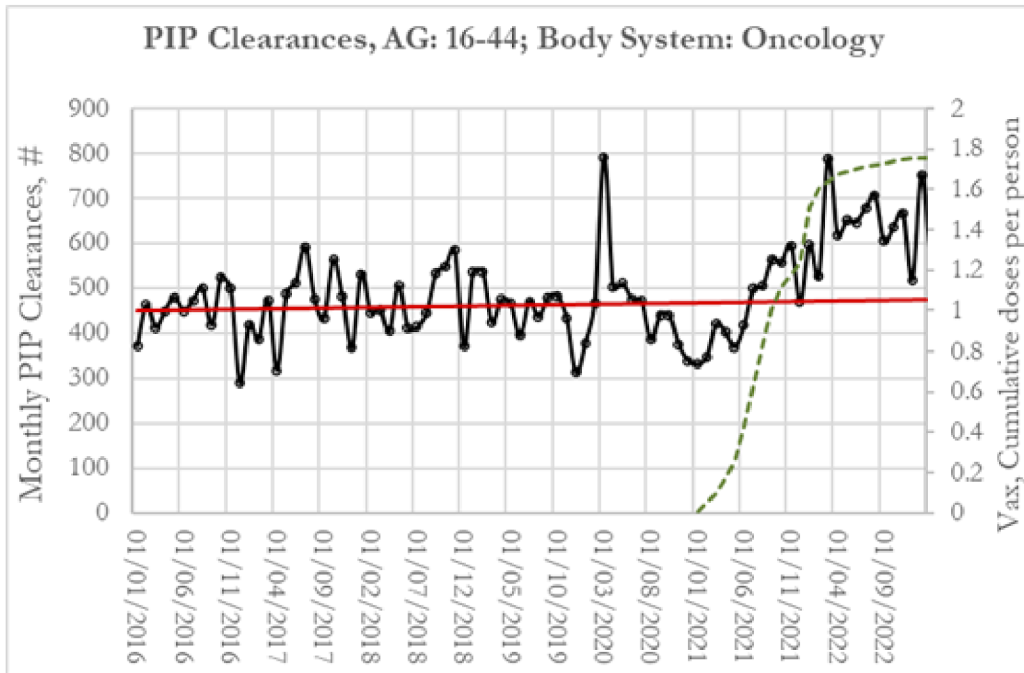
In the same paper an analysis is included of disability claims in this age group with an underlying cause of cancer. This too shows a rise commencing in the second half of 2021.
There is a clear conflict between the OHID data based on registrations and this ONS data based on either registrations or occurrence date. It is unclear why.
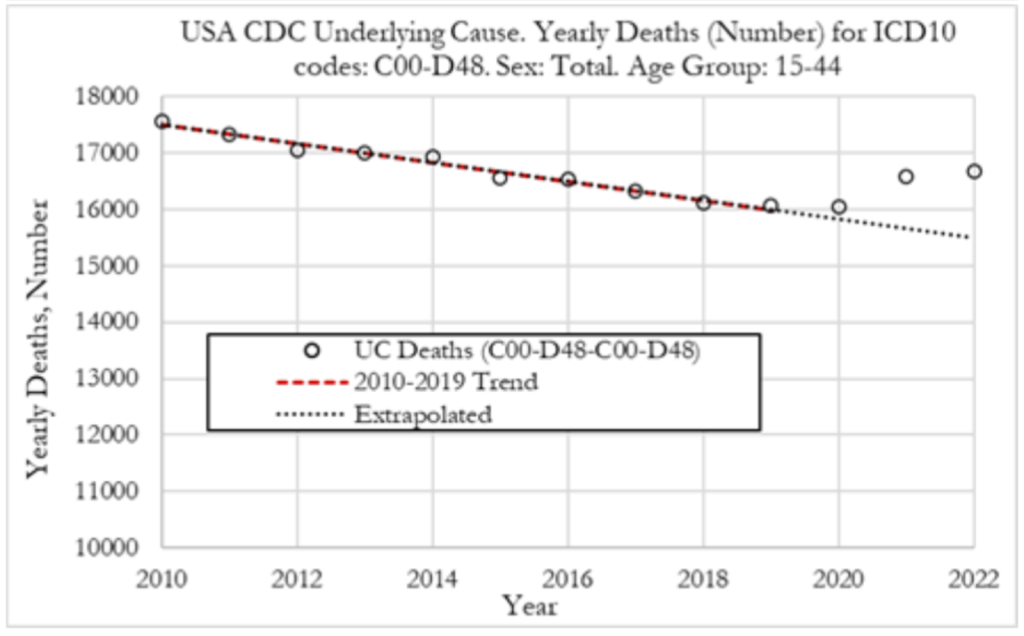
To resolve the conflict, it helps to look beyond the UK to see what has happened in other countries. In the USA, the same team has shown a similar rise in the absolute number of deaths from both malignant neoplasms and benign tumours in the 15-44 year old age group.
Public Health Scotland were publishing data on cancer diagnoses but this came to an abrupt and unexplained end in May 2022.
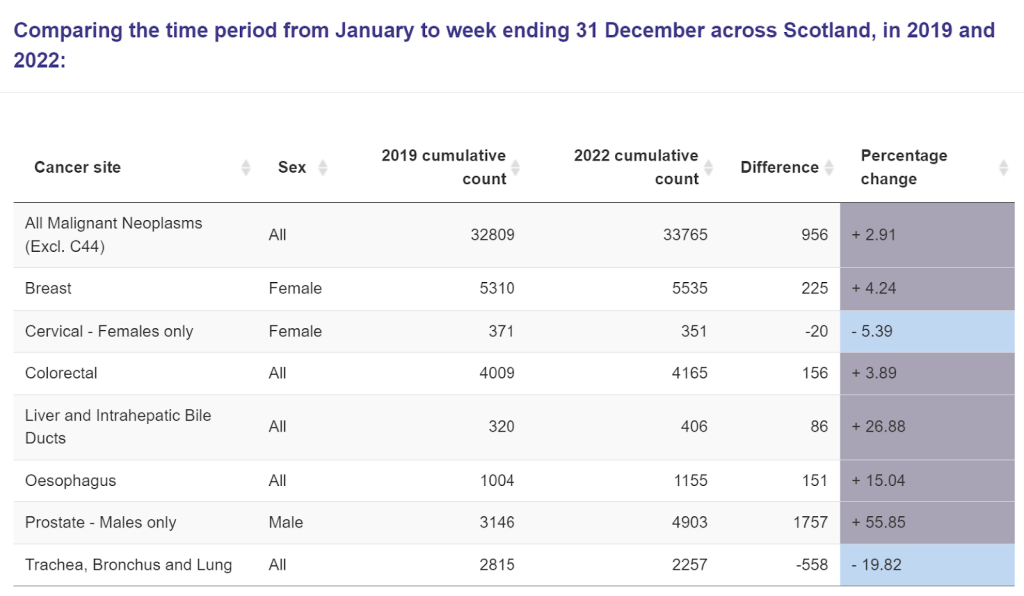
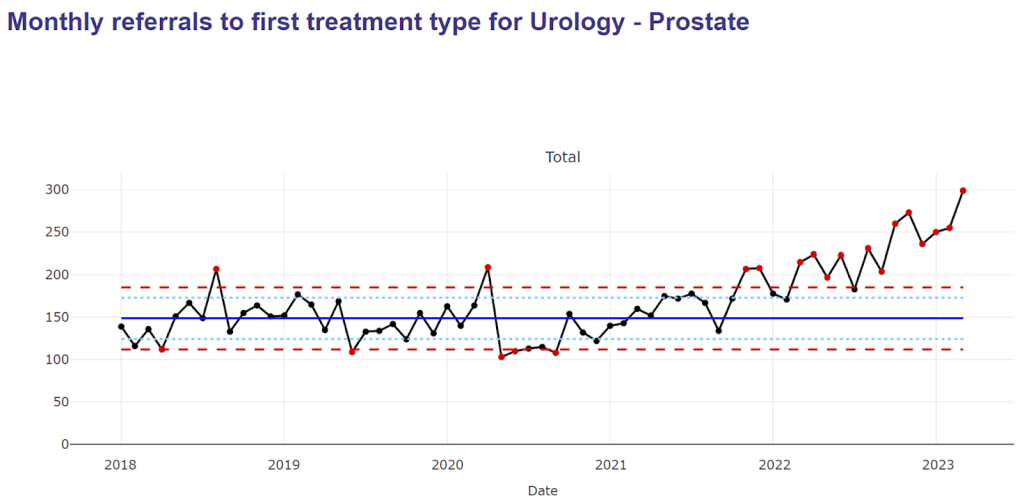
Diagnosis data stopped being published by Public Health Scotland from 2023. Other parts of the Public Health Scotland data repository contain later data, like this chart showing first treatment for prostate cancer up to March 2023, which have reached double the previous rate. Other cancer types show little change.
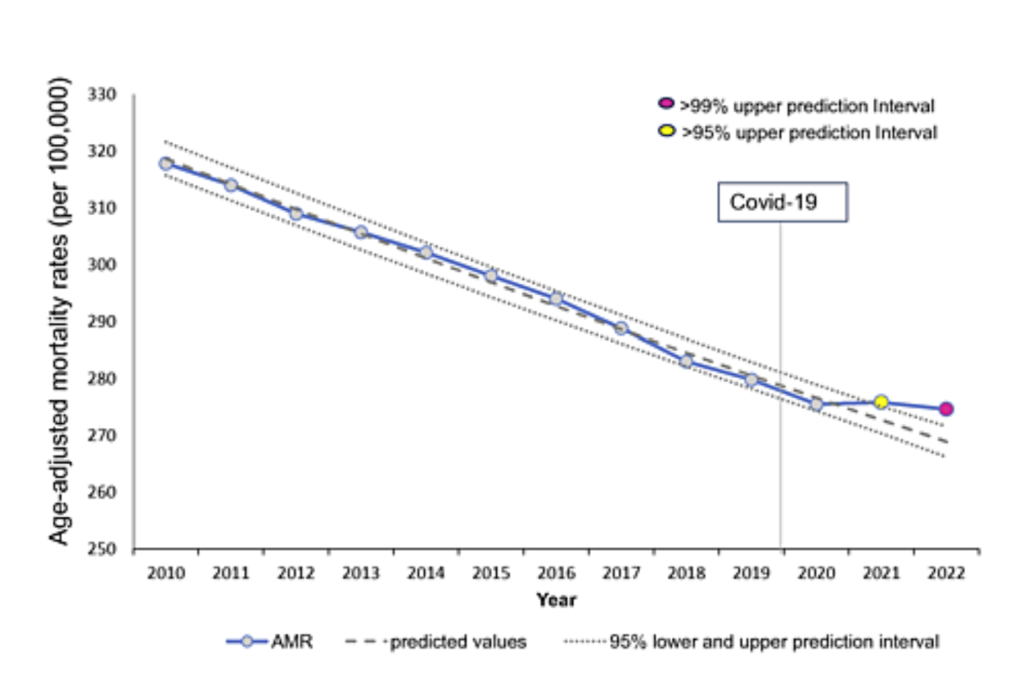
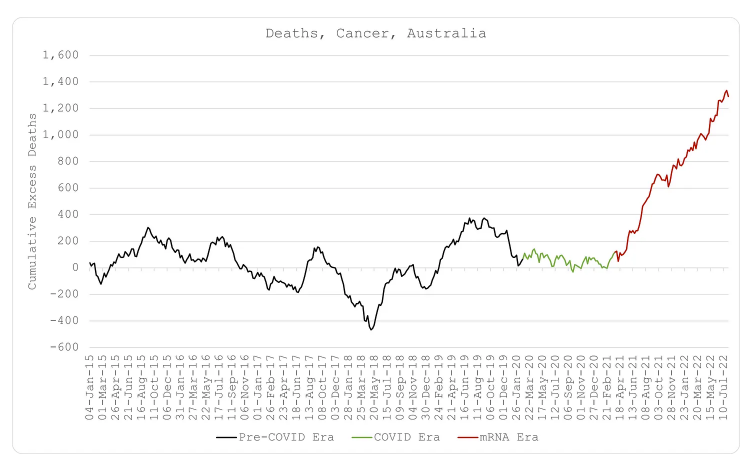
The countries discussed so far all had raised mortality in 2020 and 2021 particularly among the old, such that there was a subsequent deficit in cancer deaths in older age groups. This was not true for Japan where a similar uptick is seen even when looking at the whole population. Statistically significant rises were seen for pancreatic cancer, oral and throat cancers, leukaemias, prostate cancer and ovarian cancer as well as cancers as a whole. Australia also had little deficit among the old to hide the excess cancer deaths. It too has seen a rise in deaths from cancer overall. A third control group is Singapore which has seen a marked rise in prescriptions for numerous cancer drugs since the vaccine rollout.
The denial of the rise in cancer deaths by ministers in the Health Department is a denial of reality. No statistical knowledge is required to see the problem. Would there be such a failure to acknowledge reality if there wasn’t an accompanying fear that they know the cause for this?
